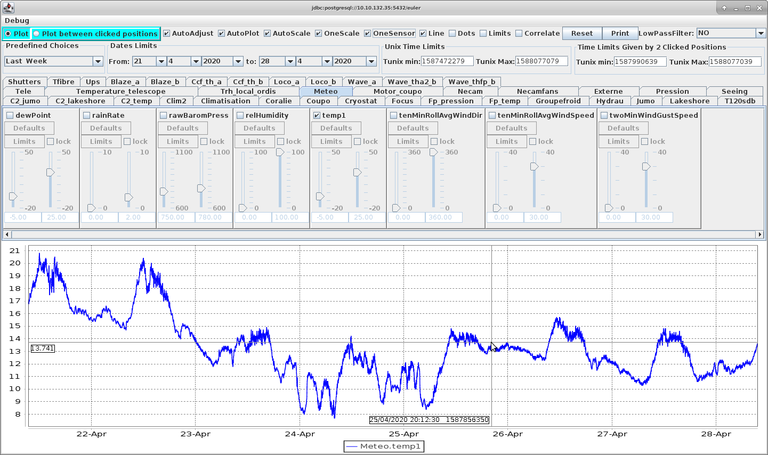
How do I view the station's sensor values (CCD temperature for example)?
At La silla or from Geneva with x2Go use:
glslogin1: meulplot

Tips:
- Meulplot display graph (lines or/and dots) by for different scale of time:
- Between 2 dates (click "plot" when the dates are completely given )
- Between 2 Unix time
- Between 2 Unix time given by mouse click
- According a scale menu
- Use the "oneSensor" mode to display a graph and deleting the previous one.
- Pulling an elastic rectangle down to the right provides a zoom; pulling an elastic rectangle to the left returns to the initial dates .
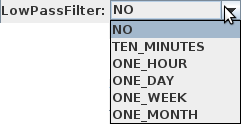
- Allows to filter the data to see the trend (mode LowPassFilter)
- Allows to correlate 2 sensors (mode Correlate)
 Adjust the end of the graph to the current time
 Plot immediately at user request
 Chose the scale automaticaly
 Plot one scale for all sensors
 Plot one sensor at a time
 Display the limits of the alarm (show only one sensor)
 Do the correlation with the two first sensors selected
 Do a request of kind AVERAGE on the BDD, It is a powerful accelerator for displaying data over a large period of time.
Remarks: Be aware that Meulplot refreshes its database every 2 minutes.
LW 28/04/2020
